Snowlastalgia
Visualizing skiing & climate change
In 2017, a team of researchers examined the relationship between skiing and climate change. They studied 247 resorts, across 6 regions, and used climate models to project the length of future seasons, visits, and revenue.
Snowlastalgia is built upon this data in an attempt to compare the outlook on skiing between the years 2010, 2050, and 2090.
Snowlastalgia
From philosopher Glenn Albrecth, the term “solastalgia” combines the Latin word for comfort—“solacium”—and “-algia”, —the Greek root for pain—to capture the complex feeling of “being homesick while still at home”.
Skiers and snowboarders, feel this solastalgia acutely every winter—how many more years will I be able to enjoy this sport? Will there be enough snow in the future to pass this tradition on to my grandchildren?
Reading the snow
The number of resorts in a region is represented by the center of each snowflake.
There are 6 regions, as defined by the National Ski Areas Association (NSAA): Pacific Northwest, Pacific Southwest, Rocky Mountains, Midwest, Northeast, and Southeast.
Length of Season
The estimated number of days in the downhill ski season is represented by the size of the next ice crystal.
The length of the season is based on projections of both the amount of natural snow and ability to create man-made snow.
Number of Visits
The estimated number of visits to resorts in the region is represented by the size of the spikes.

Rinse & Repeat
Each “arm” is then repeated 6x around the central hexagon to create a unique snowflake for each region.
Fun fact: While it’s a common saying that no two snowflakes are identical, almost every snowflake is 6-sided, due to the molecular structure of water.

Pacific Northwest
Source: Projected climate change impacts on skiing and snowmobiling: A case study of the United States. (Wobus et al., 2017)
Note: Visits and Resorts regional totals. Days and Lift Ticket Prices are regional averages. 2050 and 2090 Resorts include only those projected to have 30 or more days.
Rocky Mountains
Source: Projected climate change impacts on skiing and snowmobiling: A case study of the United States. (Wobus et al., 2017)
Note: Visits and Resorts regional totals. Days and Lift Ticket Prices are regional averages. 2050 and 2090 Resorts include only those projected to have 30 or more days.
Northeast
Source: Projected climate change impacts on skiing and snowmobiling: A case study of the United States. (Wobus et al., 2017)
Note: Visits and Resorts regional totals. Days and Lift Ticket Prices are regional averages. 2050 and 2090 Resorts include only those projected to have 30 or more days.
Pacific Southwest
Source: Projected climate change impacts on skiing and snowmobiling: A case study of the United States. (Wobus et al., 2017)
Note: Visits and Resorts regional totals. Days and Lift Ticket Prices are regional averages. 2050 and 2090 Resorts include only those projected to have 30 or more days.
Midwest
Source: Projected climate change impacts on skiing and snowmobiling: A case study of the United States. (Wobus et al., 2017)
Note: Visits and Resorts regional totals. Days and Lift Ticket Prices are regional averages. 2050 and 2090 Resorts include only those projected to have 30 or more days.
Southeast
Source: Projected climate change impacts on skiing and snowmobiling: A case study of the United States. (Wobus et al., 2017)
Note: *Visits and Resorts regional totals. *Days and Lift Ticket Prices are regional averages. *2050 & 2090 Resorts include only those projected to have 30 or more days.
Explore the Map
There are 6 regions defined by the National Ski Areas Association (NSAA).
Rocky Mountains
States: CO, ID, MT, NM, UT, WY
Resorts: 68
Season: 122 days
Snowfall: 275 in.
Revenue: $22.8 M
Pacific Northwest
States: OR, WA
Resorts: 22
Season: 121 days
Snowfall: 329 in.
Revenue: $11.5 M
Northeast
States: CT, MA, ME, NH, NY, RI, VT
Resorts: 57
Season: 111 days
Snowfall: 114 in.
Revenue: $9 M

Mountain Range

Resort
Sources: NSAA, Wobus et al. (2017), EPA Notes: States are categorized by region as defined by the NSAA. Resorts are those included in this study. Season length, snowfall, and revenue are 5 year averages (seasons 2018/19-2022/23), per resort. Mountainous regions are those defined by the EPA's Level II Ecoregions of North America.

Explore the Map
There are 6 regions defined by the National Ski Areas Association (NSAA).
Mountain Range
Resort
Sources: NSAA, Wobus et al. (2017), EPA Notes: States are categorized by region as defined by the NSAA. Resorts are those included in this study. Season length, snowfall, and revenue are 5 year averages (seasons 2018/19-2022/23), per resort. Mountainous regions are those defined by the EPA's Level II Ecoregions of North America.
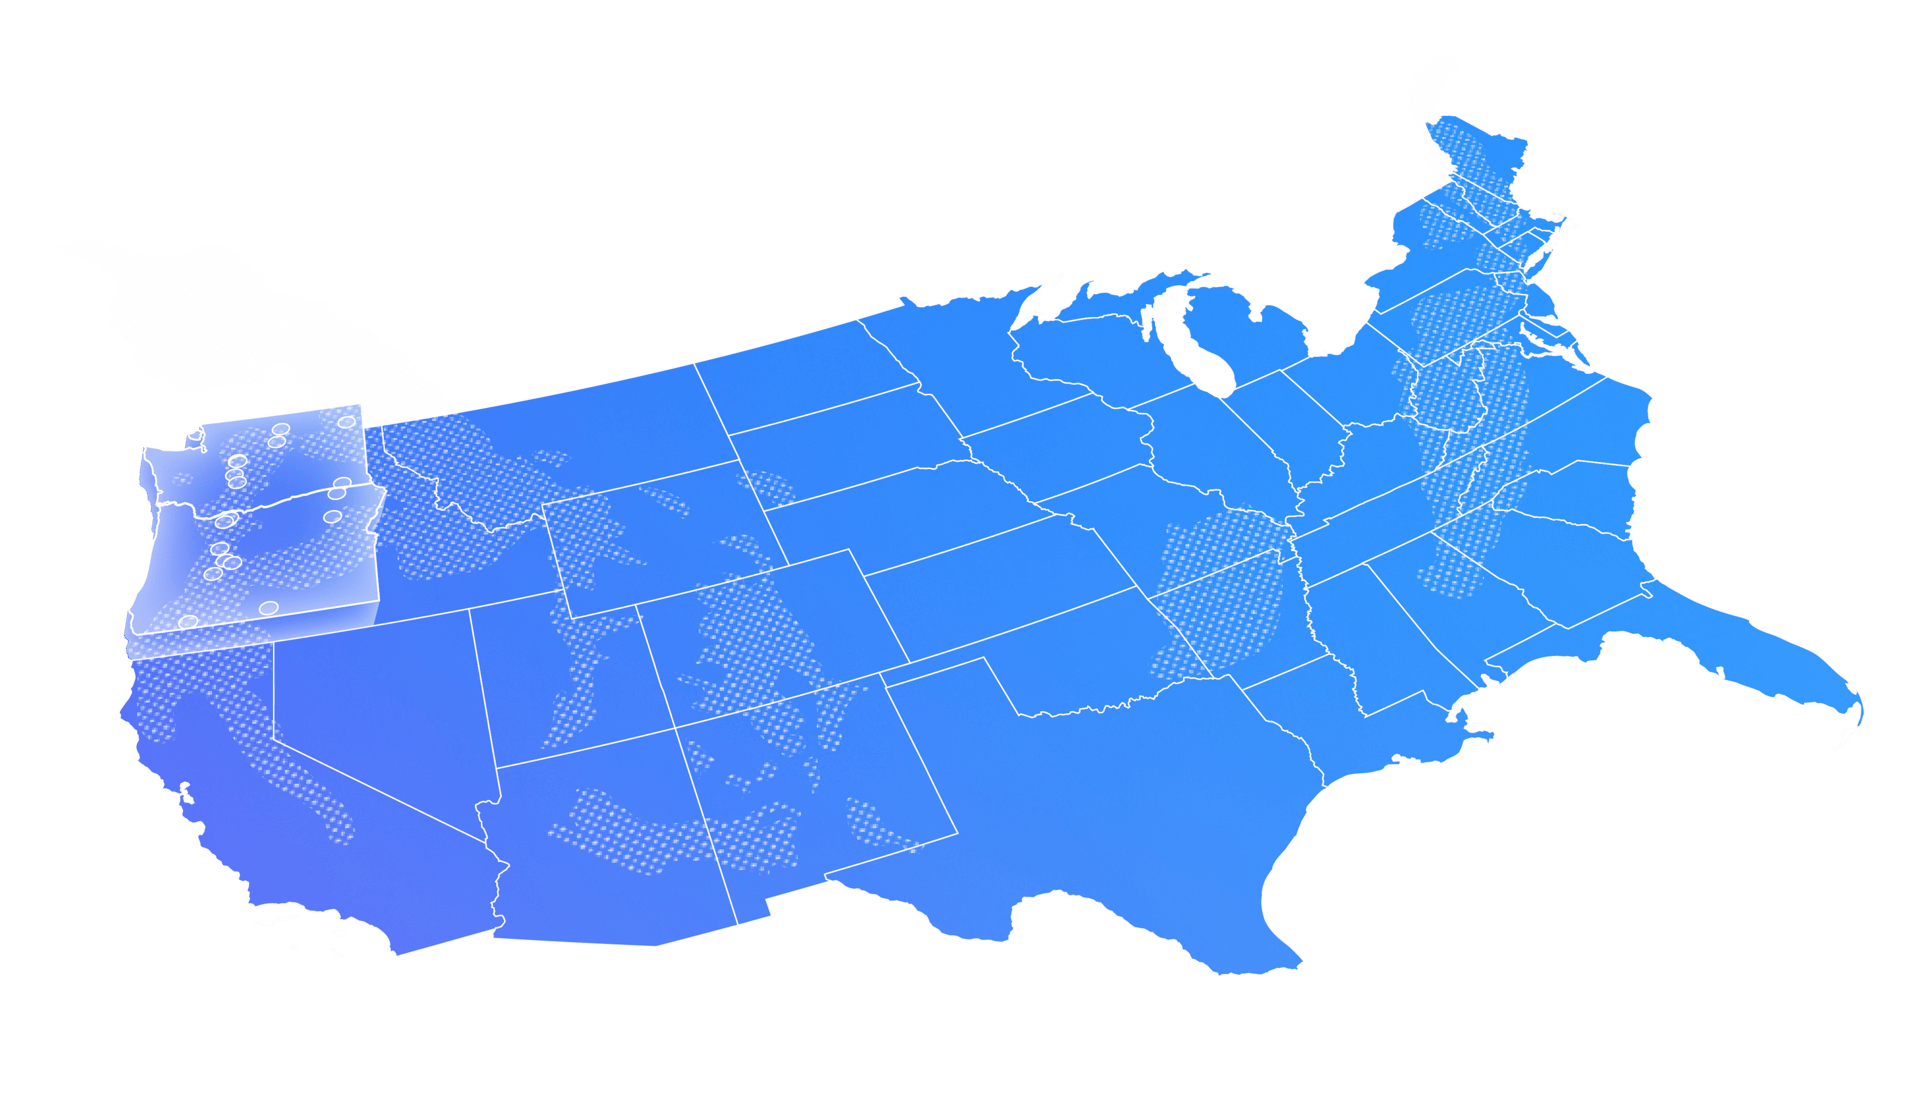
Pacific Northwest
States: OR, WA
22 resorts in the study
121 day season length
328 in. snowfall
$11.5 M revenue
Mountain Range
Resort
Sources: NSAA, Wobus et al. (2017), EPA Notes: States are categorized by region as defined by the NSAA. Resorts are those included in this study. Season length, snowfall, and revenue are 5 year averages (seasons 2018/19-2022/23), per resort. Mountainous regions are those defined by the EPA's Level II Ecoregions of North America.

Pacific Southwest
States: AZ, CA, NV
29 resorts in the study
131 day season length
326 in. snowfall
$21.3 M revenue
Mountain Range
Resort
Sources: NSAA, Wobus et al. (2017), EPA Notes: States are categorized by region as defined by the NSAA. Resorts are those included in this study. Season length, snowfall, and revenue are 5 year averages (seasons 2018/19-2022/23), per resort. Mountainous regions are those defined by the EPA's Level II Ecoregions of North America.

Rocky Mountains
States: CO, ID, MT, NM, UT, WY
68 resorts in the study
124 day season length
275 in. snowfall
$22.8 M revenue
Mountain Range
Resort
Sources: NSAA, Wobus et al. (2017), EPA Notes: States are categorized by region as defined by the NSAA. Resorts are those included in this study. Season length, snowfall, and revenue are 5 year averages (seasons 2018/19-2022/23), per resort. Mountainous regions are those defined by the EPA's Level II Ecoregions of North America.

Midwest
States: IA, IL, IN, MI, MO, MN, ND, OH, SD, WI
47 resorts in the study
90 day season length
64 in. snowfall
$3.3 M revenue
Mountain Range
Resort
Sources: NSAA, Wobus et al. (2017), EPA Notes: States are categorized by region as defined by the NSAA. Resorts are those included in this study. Season length, snowfall, and revenue are 5 year averages (seasons 2018/19-2022/23), per resort. Mountainous regions are those defined by the EPA's Level II Ecoregions of North America.

Northeast
States: CT, MA, ME, NH, NY, RI, VT
57 resorts in the study
111 day season length
114 in. snowfall
$9 M revenue
Mountain Range
Resort
Sources: NSAA, Wobus et al. (2017), EPA Notes: States are categorized by region as defined by the NSAA. Resorts are those included in this study. Season length, snowfall, and revenue are 5 year averages (seasons 2018/19-2022/23), per resort. Mountainous regions are those defined by the EPA's Level II Ecoregions of North America.

Southeast
States: DE, MD, NC, NJ, PA, VA, WV
15 resorts in the study
91 day season length
41 in. snowfall
$6.7 M revenue
Mountain Range
Resort
Sources: NSAA, Wobus et al. (2017), EPA Notes: States are categorized by region as defined by the NSAA. Resorts are those included in this study. Season length, snowfall, and revenue are 5 year averages (seasons 2018/19-2022/23), per resort. Mountainous regions are those defined by the EPA's Level II Ecoregions of North America.
Explore the Map
There are 6 regions defined by the National Ski Areas Association (NSAA).
Sources: NSAA, Wobus et al. (2017), EPA Notes: States are categorized by region as defined by the NSAA. Resorts are those included in this study. Season length, snowfall, and revenue are 5 year averages (seasons 2018/19-2022/23), per resort. Mountainous regions are those defined by the EPA's Level II Ecoregions of North America.
